How Power Factor Impacts the Efficiency of Street Lights

How Power Factor Impacts the Efficiency of Street Lights

Introduction

  • Definition of Power Factor (PF): Power factor is the ratio of real power used to perform work to the apparent power flowing in the circuit. It indicates how efficiently electrical power is converted into useful work.
  • Overview of Power Factor’s Impact on Street Lighting Efficiency: Power factor plays a crucial role in determining how effectively street lighting systems utilize electrical energy, affecting both energy consumption and lighting performance.

Understanding Power Factor

1.1 Power Factor Values (0 to 1)

  • Power factor values range from 0 to 1, with 1 representing perfect efficiency. A value closer to 1 indicates that most of the electrical power is being used for the intended purpose, while values closer to 0 indicate significant energy wastage.
A bar chart titled "Energy Consumption vs. Power Factor." The chart illustrates how energy consumption (in kWh) varies with different power factor (PF) levels.  

- The x-axis represents power factor levels: PF 0.5, PF 0.7, PF 0.9, and PF 1.0.  
- The y-axis represents energy consumption, ranging from 0 to 120 kWh.  

Details:  
- PF 0.5 (orange bar): Energy consumption is the highest, around 120 kWh.  
- PF 0.7 (green bar): Energy consumption decreases to approximately 100 kWh.  
- PF 0.9 (blue bar): Energy consumption is further reduced to about 80 kWh.  
- PF 1.0 (red bar): Energy consumption is the lowest, around 70 kWh.  

The chart highlights the correlation between higher power factor and reduced energy consumption.

1.2 Importance of a High Power Factor

  • A high power factor is essential for minimizing energy losses. It leads to more efficient energy conversion, reduces operational costs, and ensures better performance of the lighting system, which is crucial for street lighting projects.
A pie chart titled "Maintenance Cost Comparison." The chart compares the maintenance costs of two lighting technologies:  

- **LED (orange segment):** Represents 20% of the total maintenance cost.  
- **HPS (yellow segment):** Represents 80% of the total maintenance cost.  

The chart highlights that LED lights have significantly lower maintenance costs compared to HPS (High-Pressure Sodium) lights.

The Role of Power Factor in Street Lighting Efficiency

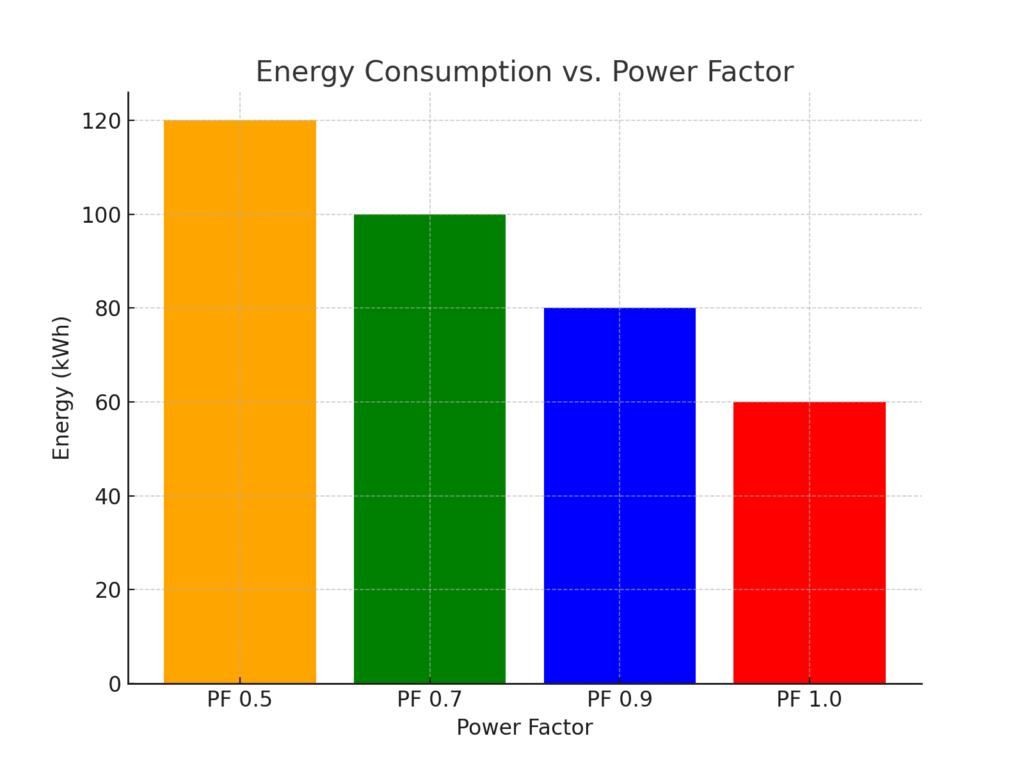
2.1 Energy Utilization

  • A higher power factor signifies better conversion of electrical power into light, reducing the energy wasted as heat or reactive power. This leads to more efficient energy usage in street lighting systems, translating to fewer energy losses.

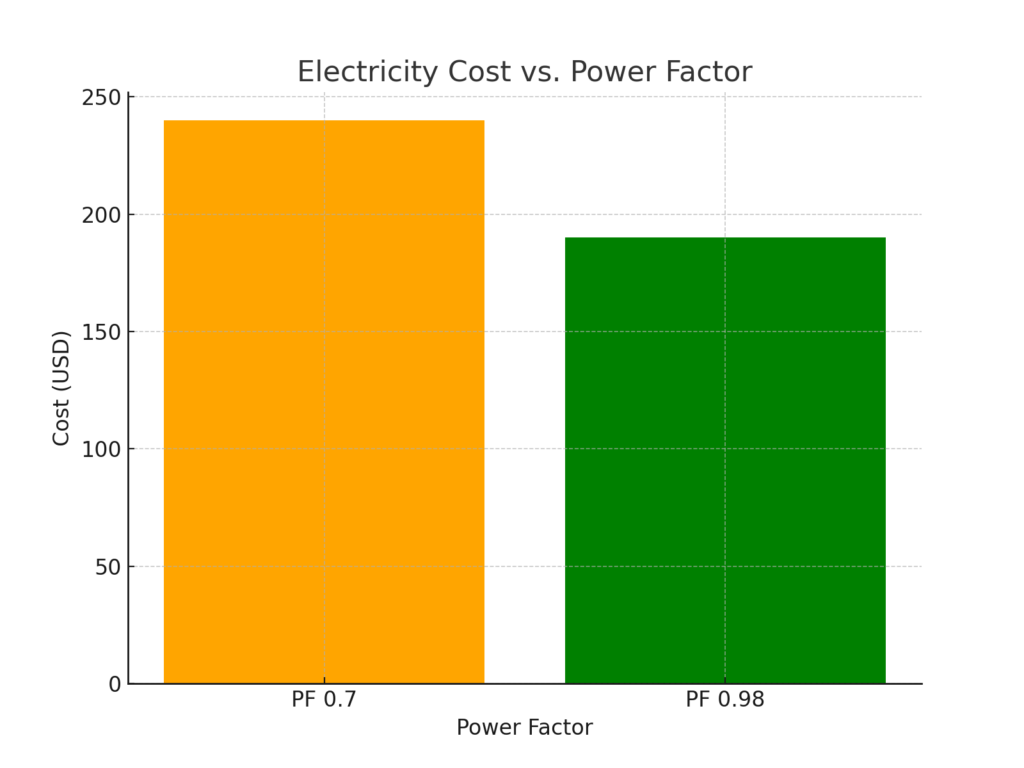
2.2 Cost Implications

  • Power factor directly impacts the electricity bills for municipalities and businesses. Low power factor systems require more power to achieve the same illumination, resulting in higher operational costs. High PF street lights, on the other hand, reduce energy consumption, leading to cost savings over time.
A bar chart titled "Electricity Cost vs. Power Factor." The chart compares electricity costs (in USD) for two power factor levels.  

- The x-axis represents power factor levels: PF 0.7 and PF 0.98.  
- The y-axis represents electricity costs, ranging from 0 to 250 USD.  

Details:  
- PF 0.7 (orange bar): Electricity cost is approximately 250 USD.  
- PF 0.98 (green bar): Electricity cost is lower, approximately 200 USD.  

The chart demonstrates that a higher power factor (PF 0.98) leads to reduced electricity costs compared to a lower power factor (PF 0.7).

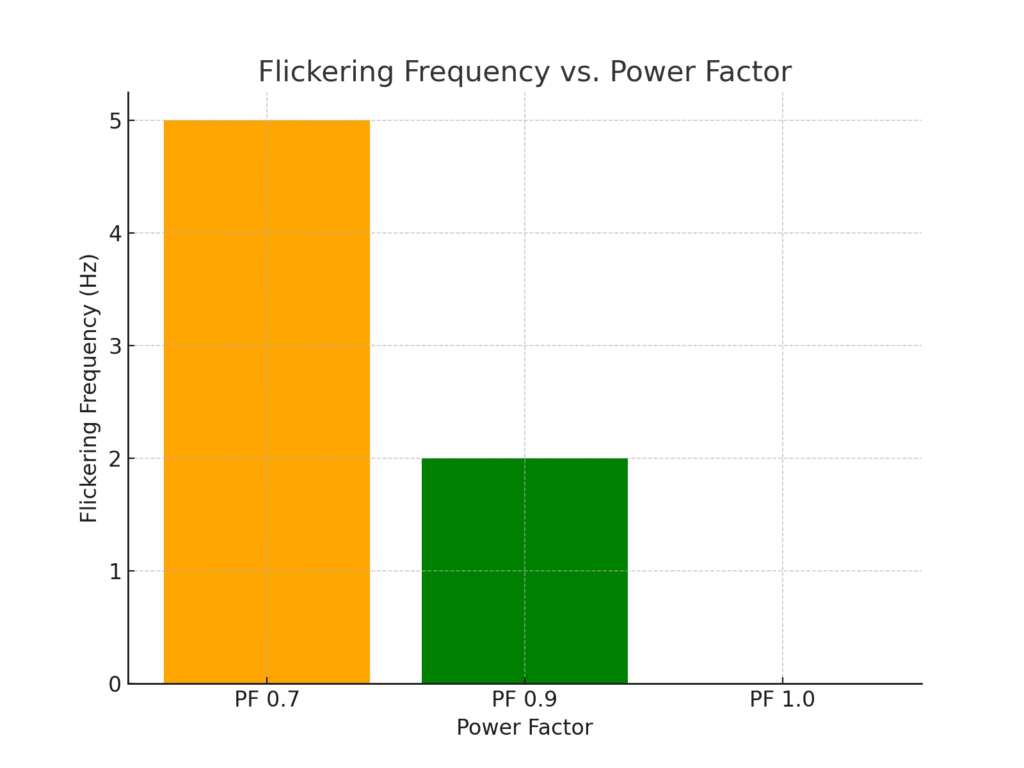
Effects on Lighting Quality

  • Lighting Quality and Stability: A low power factor can result in issues like flickering, instability, and poor performance of street lights, which can be hazardous in outdoor environments. High PF ensures stable, high-quality illumination, enhancing safety and visibility on streets.
A bar chart titled "Flickering Frequency vs. Power Factor." The chart compares flickering frequency (in Hz) at different power factor (PF) levels.  

- The x-axis represents power factor levels: PF 0.7, PF 0.9, and PF 1.0.  
- The y-axis represents flickering frequency, ranging from 0 to 5 Hz.  

Details:  
- PF 0.7 (orange bar): Flickering frequency is the highest at 5 Hz.  
- PF 0.9 (green bar): Flickering frequency is reduced to 2 Hz.  
- PF 1.0 (not shown as a bar): Flickering frequency is assumed to approach 0 Hz.  

The chart illustrates that higher power factors reduce flickering frequency, improving light stability.

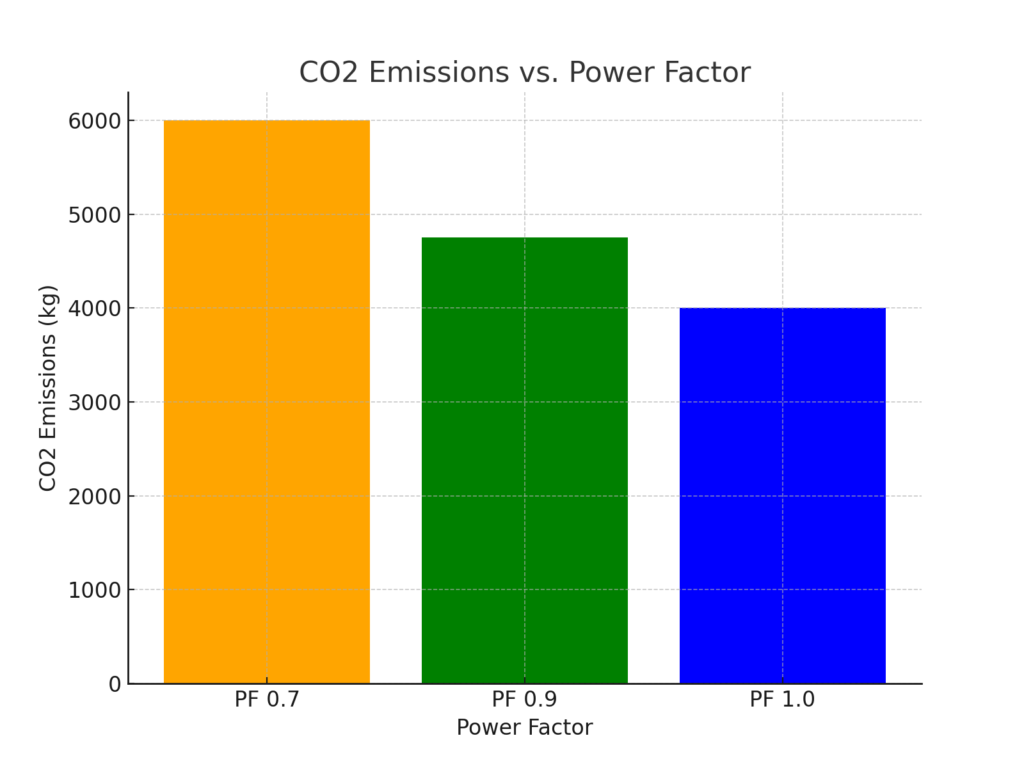
Environmental Impact

  • Energy Consumption and Carbon Emissions: High power factor street lights consume less energy and contribute to reduced carbon emissions. As global sustainability efforts intensify, upgrading street lighting systems to high PF models can significantly reduce the carbon footprint, aligning with eco-friendly goals.
A bar chart titled "CO2 Emissions vs. Power Factor." The chart compares CO2 emissions (in kilograms) for different power factor (PF) levels.  

- The x-axis represents power factor levels: PF 0.7, PF 0.9, and PF 1.0.  
- The y-axis represents CO2 emissions, ranging from 0 to 6000 kg.  

Details:  
- PF 0.7 (orange bar): CO2 emissions are the highest at 6000 kg.  
- PF 0.9 (green bar): CO2 emissions are reduced to approximately 4500 kg.  
- PF 1.0 (blue bar): CO2 emissions are the lowest at around 3000 kg.  

The chart highlights that increasing the power factor significantly reduces CO2 emissions, contributing to environmental sustainability.

Factors Influencing Power Factor in Street Lights

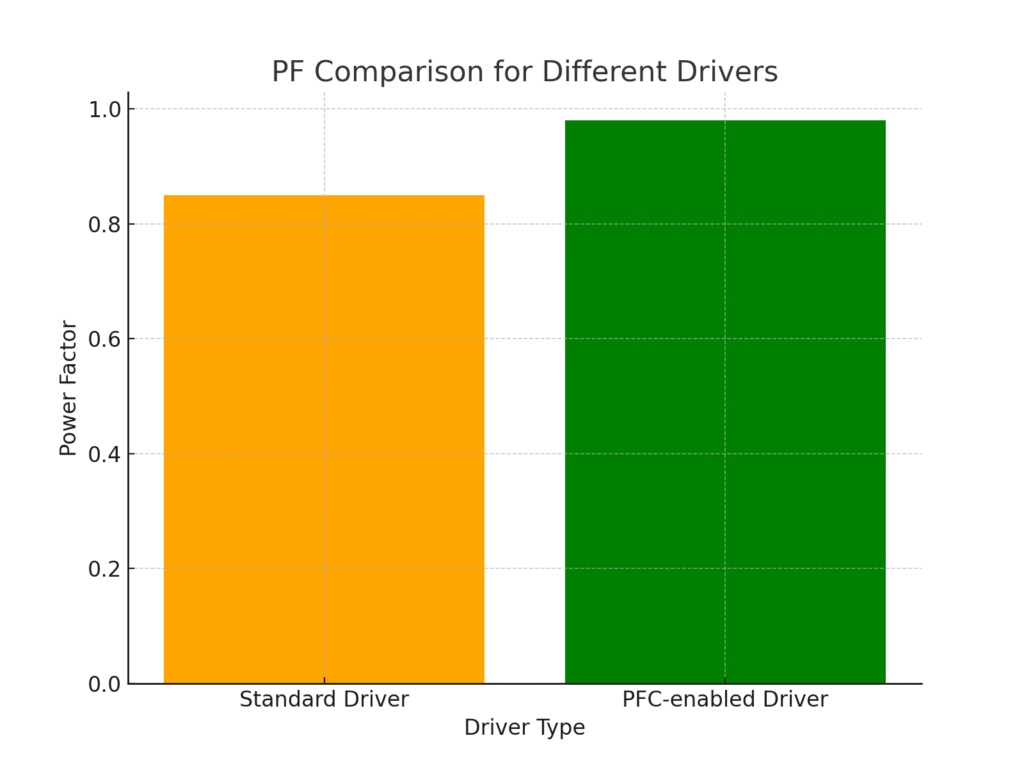
3.1 Quality of LED Drivers

  • The LED driver is a key component in determining the power factor of street lights. High-quality drivers with power factor correction (PFC) ensure efficient power conversion and minimize energy losses, contributing to a high PF.
A bar chart titled "PF Comparison for Different Drivers." The chart compares the power factor (PF) for two types of drivers:  

- The x-axis represents the driver types: "Standard Driver" and "PFC-enabled Driver."  
- The y-axis represents the power factor, ranging from 0.0 to 1.0.  

Details:  
- **Standard Driver (orange bar):** Power factor is approximately 0.8.  
- **PFC-enabled Driver (green bar):** Power factor is 1.0, indicating optimal efficiency.  

The chart demonstrates that PFC-enabled drivers achieve a higher power factor compared to standard drivers, highlighting their improved energy efficiency.

3.2 Total Harmonic Distortion (THD)

  • Total Harmonic Distortion (THD) refers to distortions in the electrical waveform caused by non-linear loads. High THD levels can reduce the power factor by introducing inefficiencies in the system. Using lighting systems with low THD is essential for maintaining a high power factor.

3.3 Load Conditions

  • The number and type of lights connected to a street lighting system can impact its overall power factor. Overloading or underloading the system can lead to inefficiencies. Proper load management and balancing are necessary to ensure that the system operates with an optimal power factor.

Case Studies and Real-World Applications

A grouped bar chart titled "Comparison Before and After Upgrade." The chart compares energy consumption, electricity cost, and maintenance cost before and after an upgrade.  

- The x-axis represents three categories: Energy Consumption (kWh), Electricity Cost (USD), and Maintenance Cost (USD).  
- The y-axis represents the values, ranging from 0 to 14,000.  
- The orange bars represent "Before Upgrade," and the green bars represent "After Upgrade."  

Details:  
- **Energy Consumption (kWh):**  
  - Before Upgrade (orange): Approximately 14,000 kWh.  
  - After Upgrade (green): Approximately 10,000 kWh.  
- **Electricity Cost (USD):**  
  - Before Upgrade (orange): Around 2,500 USD.  
  - After Upgrade (green): Around 2,000 USD.  
- **Maintenance Cost (USD):**  
  - Before Upgrade (orange): Around 500 USD.  
  - After Upgrade (green): Around 200 USD.  

The chart demonstrates significant reductions in all three categories after the upgrade, highlighting the benefits of improved efficiency and lower costs.
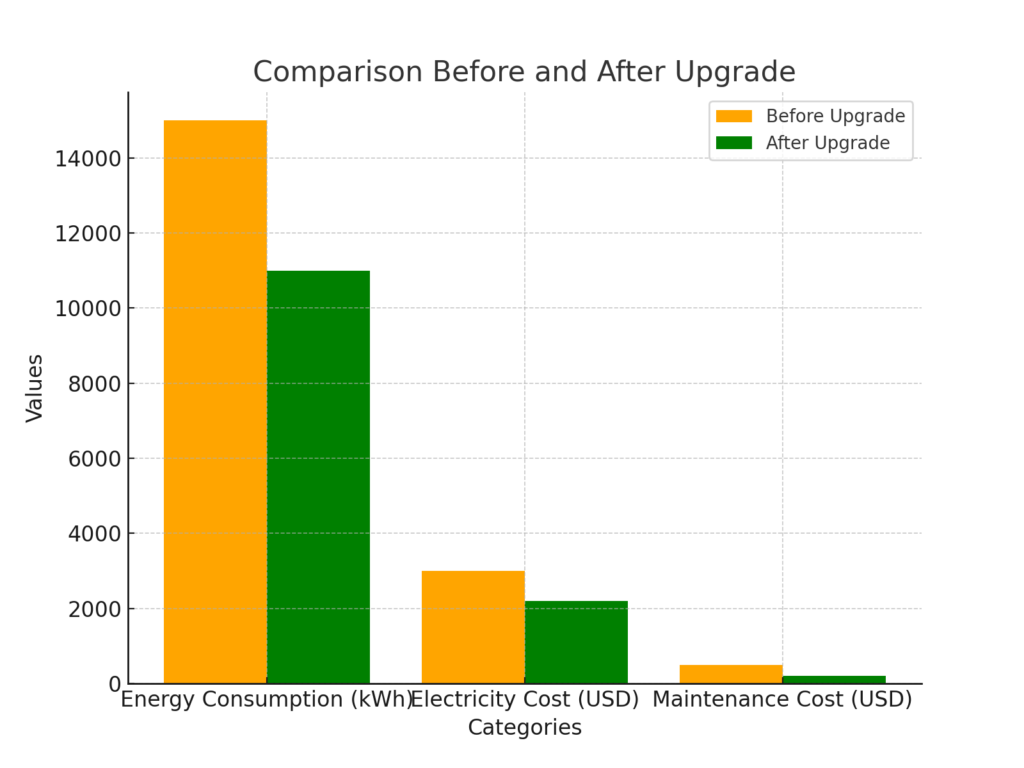
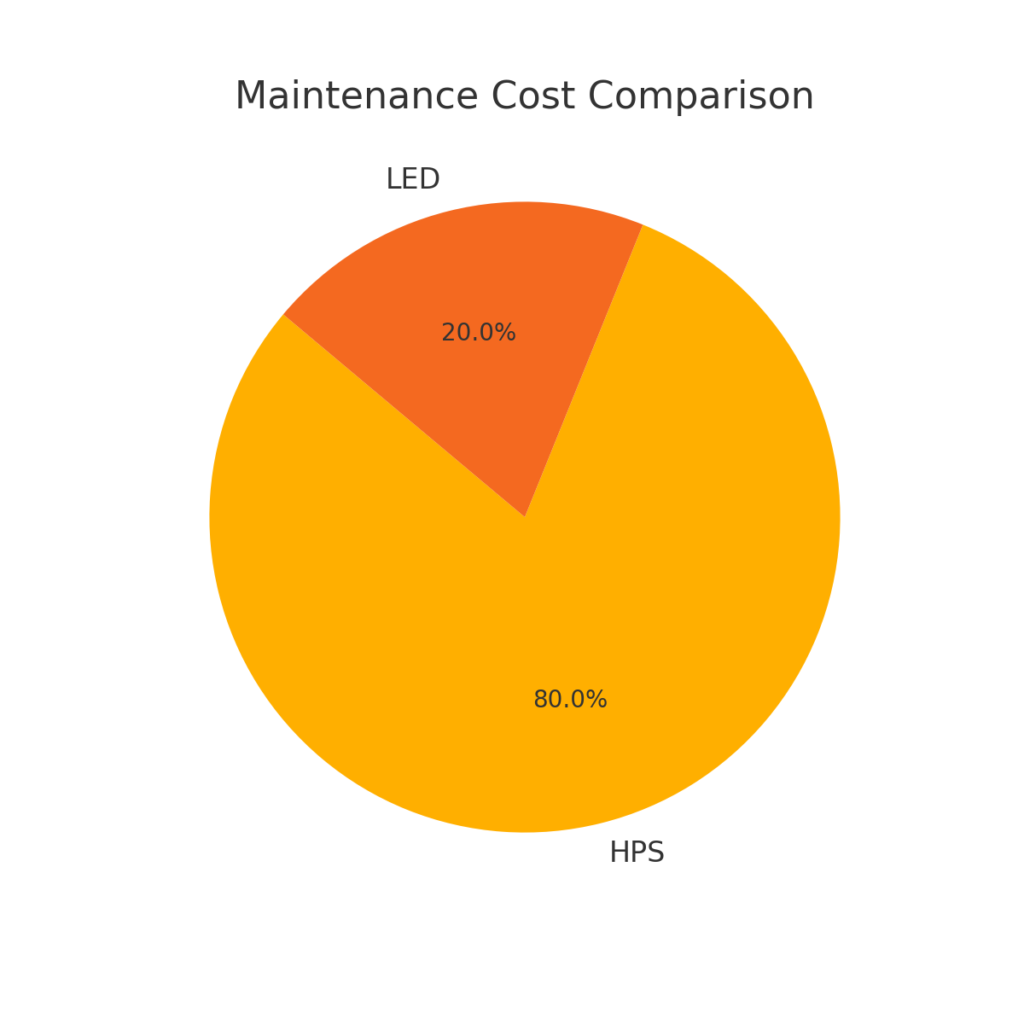
  • Municipal Examples: Several municipalities have successfully improved their street lighting efficiency by upgrading to high power factor LED lights. For example, cities that replaced traditional sodium lights with high PF LEDs reported substantial reductions in energy consumption and operational costs.
  • Statistical Data: Data from these projects indicate that municipalities can save significant amounts on energy bills while achieving higher lighting quality and reliability.

Conclusion

  • Recap of the Importance of Power Factor: Power factor is a critical factor in optimizing street lighting efficiency, reducing energy consumption, lowering costs, and improving lighting quality.
  • Call to Action: Municipalities and businesses should prioritize power factor when selecting street lighting solutions to ensure long-term savings, superior performance, and environmental sustainability.

LED Lighting Expert

Grace | LED Outdoor Lighting Expert Specializing in streetlights, floodlights & tunnel lights. Delivering durable, energy-efficient solutions worldwide.
📍 China-based, exporting globally
✅ Custom solutions 5-year warranty
🔍 [Get a Free Quote!]

Want the Best Pricing & Custom Solutions? Stay Connected!

Ask For A Quick Quote

We will contact you within 1 working day, please pay attention to the email with the suffix “info@ledmvs.com”